Xenographics
Weird but (sometimes) useful charts
Search for:
Home
About
Submit
Tags
correlation
distribution
domain specific
geo
hierarchy
high dimensional
mashup
network
scale stacking
time
Articles
On Graphonyms: the Importance of Chart Type Names
Contact
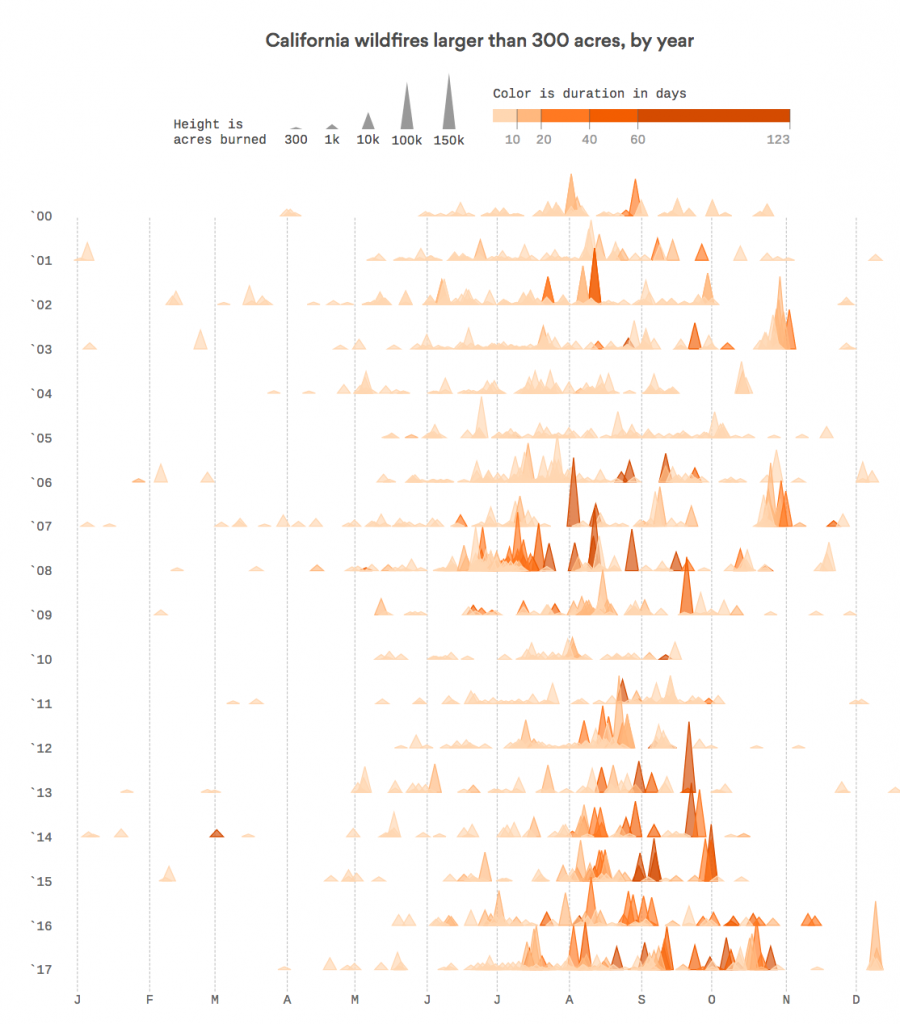
Fire plot
1st April 2018
maartenzam
Wildfires are burning longer and hotter each year
Post navigation
Swing graphs
Hierarchy timeline