Xenographics

Weird but (sometimes) useful charts

  • Home
  • About
  • Submit
  • Tags
    • correlation
    • distribution
    • domain specific
    • geo
    • hierarchy
    • high dimensional
    • mashup
    • network
    • scale stacking
    • time
  • Articles
    • On Graphonyms: the Importance of Chart Type Names
  • Contact

Probabilistic graph

21st April 20184th October 2018maartenzam
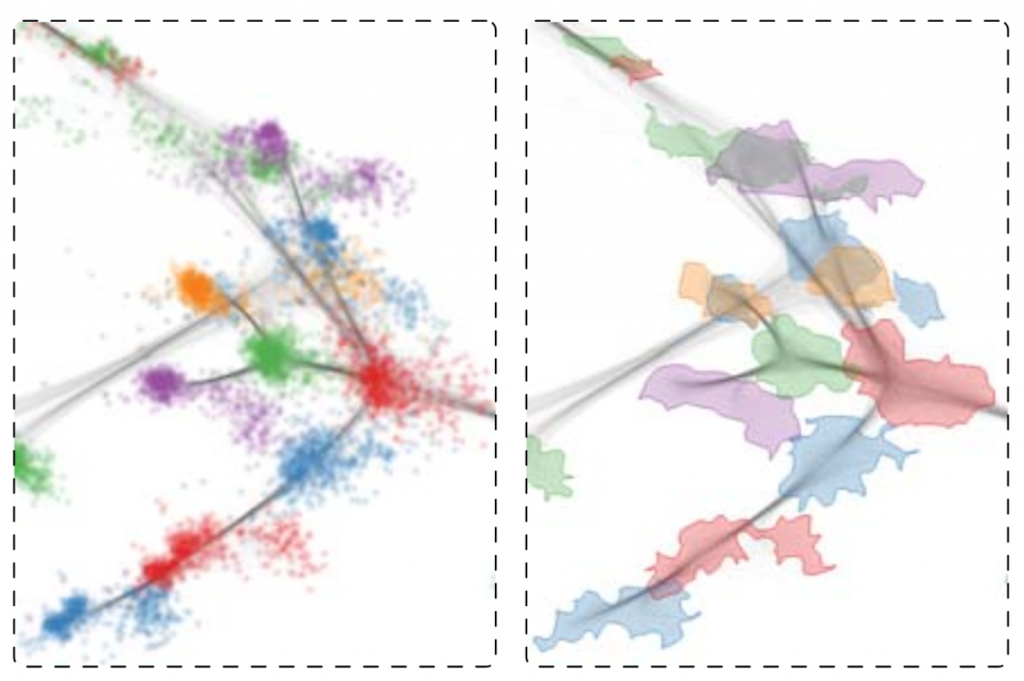
A novel uncertain network visualization technique based on node-link diagrams. Nodes expand spatially in our probabilistic graph layout, depending on the underlying probability distributions of edges. The visualization is created by computing a two-dimensional graph embedding that combines samples from the probabilistic graph

Probabilistic Graph Layout for Uncertain Network Visualization

Post navigation

Maptrix
Star coordinates
Copyright © 2026 Xenographics.
Theme Highriser by ThemeMunk. Powered by WordPress.