Xenographics

Weird but (sometimes) useful charts

  • Home
  • About
  • Submit
  • Tags
    • correlation
    • distribution
    • domain specific
    • geo
    • hierarchy
    • high dimensional
    • mashup
    • network
    • scale stacking
    • time
  • Articles
    • On Graphonyms: the Importance of Chart Type Names
  • Contact

Braided graph

31st March 2018maartenzam

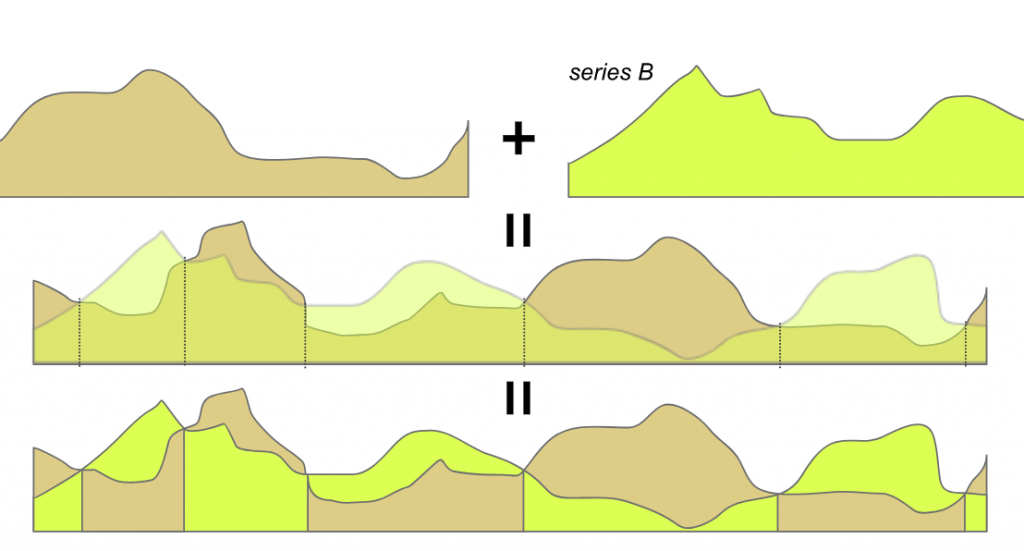
A novel visualization technique that we call a braided graph where filled areas are sorted in depth order for each position along the time axis.

Graphical Perception of Multiple Time Series

Post navigation

Wrapped bar graph
Dot-boxplot
Copyright © 2023 Xenographics.
Theme Highriser by ThemeMunk. Powered by WordPress.