We propose the use of glyphs with parallel coordinate plots to show all survey responses in a single view and design an interactive visual analytics tool around the representation to explore the data.
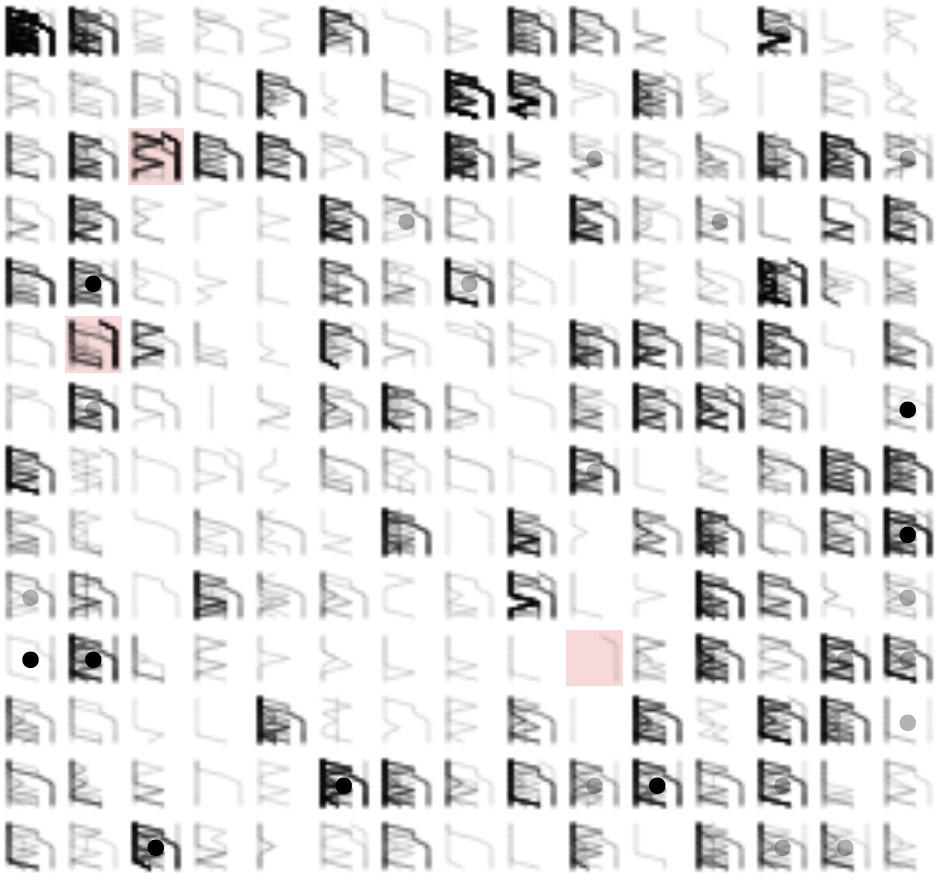
Glyph matrix
Weird but (sometimes) useful charts
We propose the use of glyphs with parallel coordinate plots to show all survey responses in a single view and design an interactive visual analytics tool around the representation to explore the data.