Xenographics

Weird but (sometimes) useful charts

  • Home
  • About
  • Submit
  • Tags
    • correlation
    • distribution
    • domain specific
    • geo
    • hierarchy
    • high dimensional
    • mashup
    • network
    • scale stacking
    • time
  • Articles
    • On Graphonyms: the Importance of Chart Type Names
  • Contact

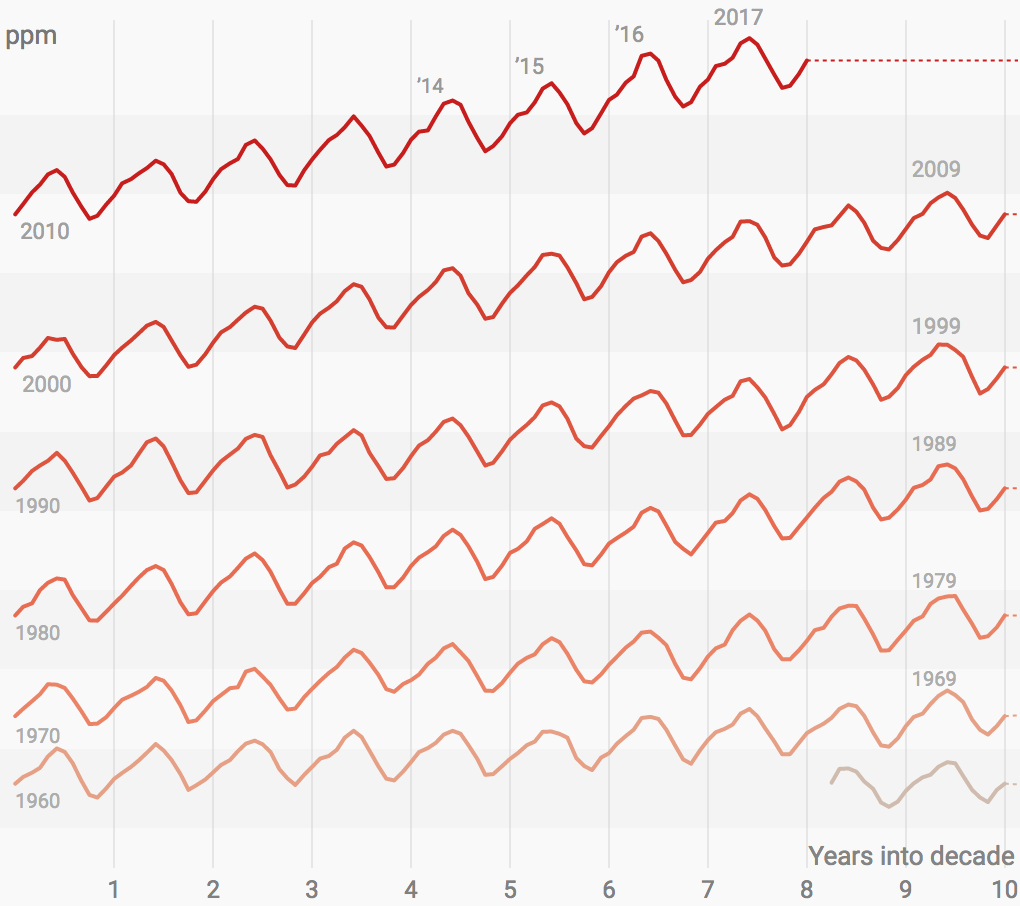
Stacked line chart

27th March 2018maartenzam

Breaking and stacking the x axis.

Source: Carbon dioxide concentration over time

Post navigation

Glyph matrix
Cycle plot
Copyright © 2023 Xenographics.
Theme Highriser by ThemeMunk. Powered by WordPress.