Xenographics

Weird but (sometimes) useful charts

  • Home
  • About
  • Submit
  • Tags
    • correlation
    • distribution
    • domain specific
    • geo
    • hierarchy
    • high dimensional
    • mashup
    • network
    • scale stacking
    • time
  • Articles
    • On Graphonyms: the Importance of Chart Type Names
  • Contact

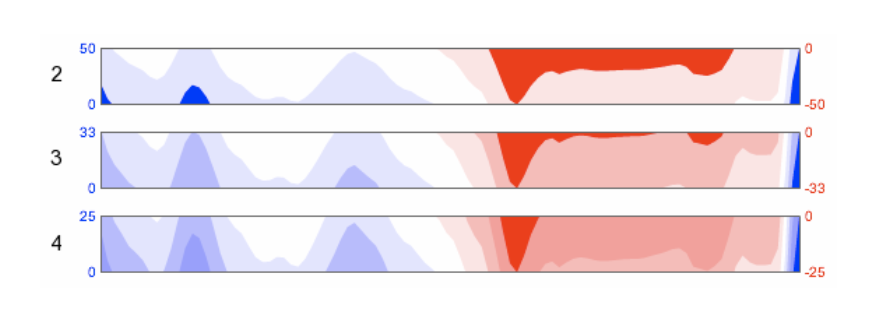
Horizon chart

25th March 201827th March 2018maartenzam
A space-efficient time series visualization technique

Source: Sizing the Horizon: The Effects of Chart Size and Layering on the Graphical Perception of Time Series Visualizations

Post navigation

Drunken speedometer
Scatterplot of line charts
Copyright © 2023 Xenographics.
Theme Highriser by ThemeMunk. Powered by WordPress.