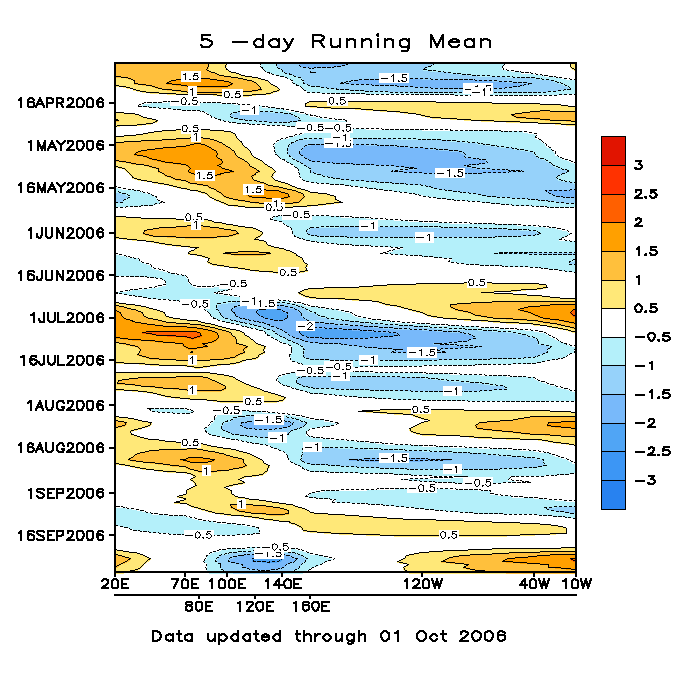
The axes of a Hovmöller diagram are typically longitude or latitude (abscissa or x-axis) and time (ordinate or y-axis) with the value of some field represented through color or shading. Hovmöller diagrams are also used to plot the time evolution of vertical profiles of scalar quantities such as temperature, density, or concentrations of constituents in the atmosphere or ocean.
Source: Hovmöller diagram – Wikipedia