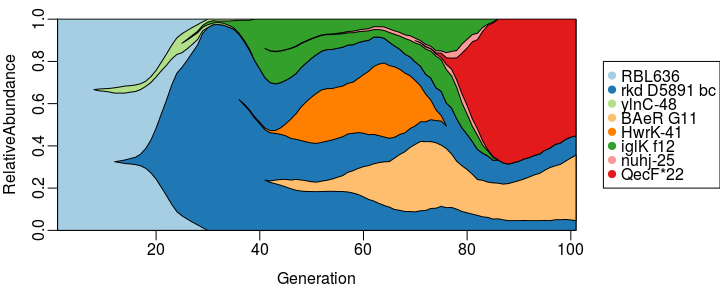
A Muller plot combines information about the succession of different OTUs (genotypes, phenotypes, species, …) and information about dynamics of their abundances (populations or frequencies) over time.
Source: Muller plot – Wikipedia
Weird but (sometimes) useful charts
A Muller plot combines information about the succession of different OTUs (genotypes, phenotypes, species, …) and information about dynamics of their abundances (populations or frequencies) over time.
Source: Muller plot – Wikipedia