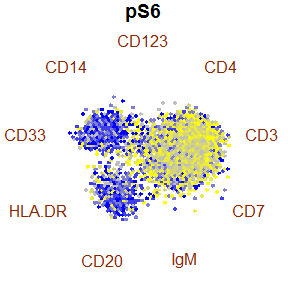
Radviz is a dimensionality-reduction technique using dimensional anchors to visualize multivariate datasets in a 2D projection, as originally described in Hoffman et al 1999. Image taken from Visualizing Multivariate Data with Radviz.
Weird but (sometimes) useful charts
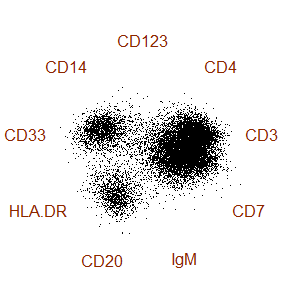
Radviz is a dimensionality-reduction technique using dimensional anchors to visualize multivariate datasets in a 2D projection, as originally described in Hoffman et al 1999. Image taken from Visualizing Multivariate Data with Radviz.