Xenographics

Weird but (sometimes) useful charts

  • Home
  • About
  • Submit
  • Tags
    • correlation
    • distribution
    • domain specific
    • geo
    • hierarchy
    • high dimensional
    • mashup
    • network
    • scale stacking
    • time
  • Articles
    • On Graphonyms: the Importance of Chart Type Names
  • Contact

Time map

15th October 201815th October 2018Nicolas Kruchten

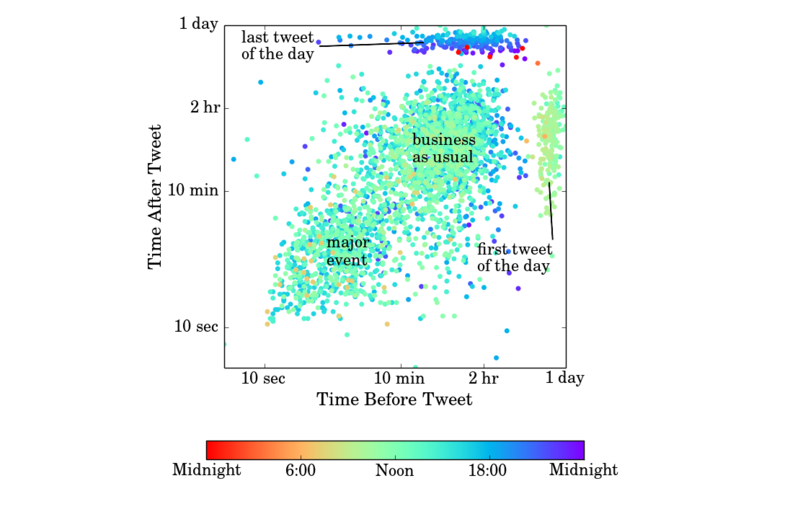
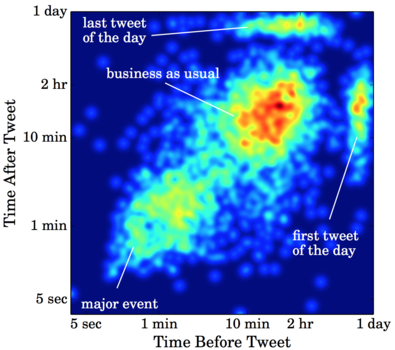
Time maps are two-dimensional plots displaying the timings between events that can reveal both outliers and hidden structure. Adopted from the field of chaotic systems, time maps allow users to identify features that can take place on timescales ranging from milliseconds to months, all within a single image.

Time maps: A tool for visualizing many discrete events across multiple timescales

timemap obama_heat_N_medium.png

Post navigation

Manhattan plot
Radviz
Copyright © 2023 Xenographics.
Theme Highriser by ThemeMunk. Powered by WordPress.