Xenographics

Weird but (sometimes) useful charts

  • Home
  • About
  • Submit
  • Tags
    • correlation
    • distribution
    • domain specific
    • geo
    • hierarchy
    • high dimensional
    • mashup
    • network
    • scale stacking
    • time
  • Articles
    • On Graphonyms: the Importance of Chart Type Names
  • Contact

Streamline variability plot

23rd April 201823rd April 2018maartenzam

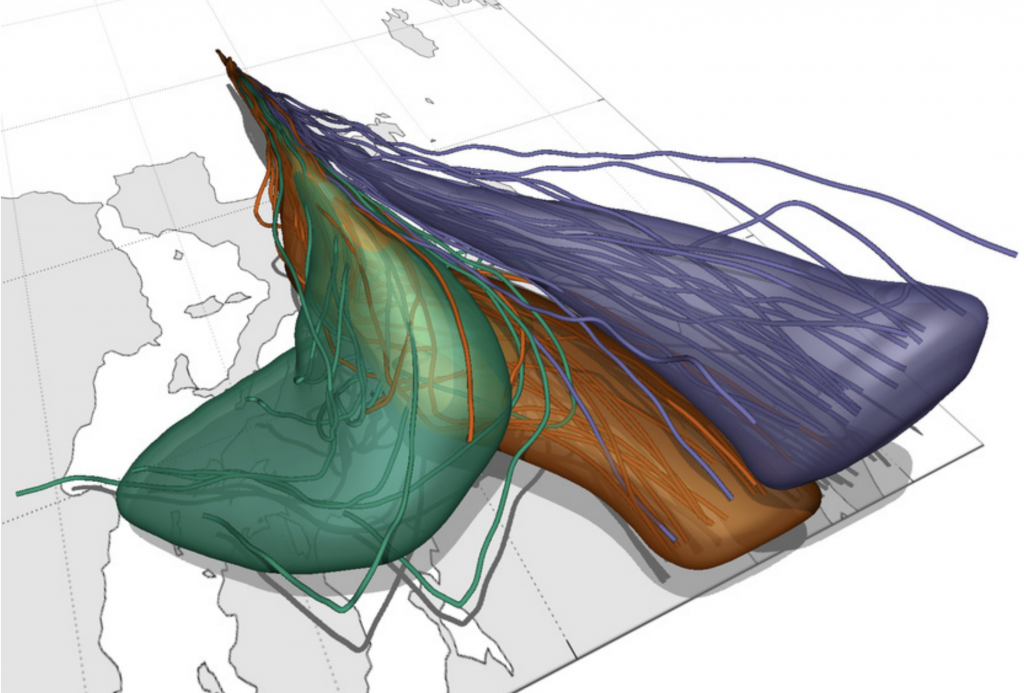
We use principal component analysis to transform the set of streamlines into a low-dimensional Euclidean space. In this space the streamlines are clustered into major trends, and each cluster is in turn approximated by a multivariate Gaussian distribution.

Streamline Variability Plots for Characterizing the Uncertainty in Vector Field Ensembles

Post navigation

Star coordinates
Solar correlation map
Copyright © 2023 Xenographics.
Theme Highriser by ThemeMunk. Powered by WordPress.