Xenographics

Weird but (sometimes) useful charts

  • Home
  • About
  • Submit
  • Tags
    • correlation
    • distribution
    • domain specific
    • geo
    • hierarchy
    • high dimensional
    • mashup
    • network
    • scale stacking
    • time
  • Articles
    • On Graphonyms: the Importance of Chart Type Names
  • Contact

UnTangle map

23rd April 2018maartenzam

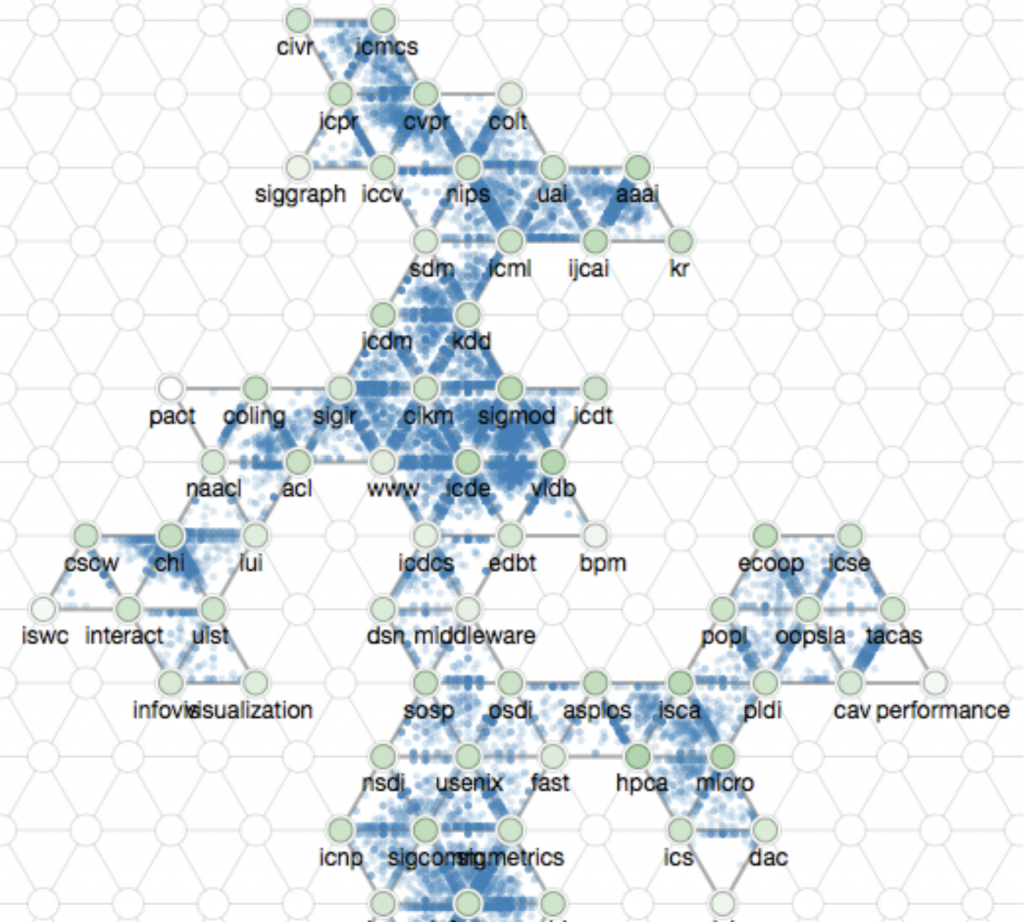
An improved method for visualizing probabilistic multi-label data.

UnTangle Map: Visual Analysis of Probabilistic Multi-Label Data

Post navigation

Solar correlation map
Orientation-enhanced parallel coordinate plot
Copyright © 2026 Xenographics.
Theme Highriser by ThemeMunk. Powered by WordPress.