Xenographics

Weird but (sometimes) useful charts

  • Home
  • About
  • Submit
  • Tags
    • correlation
    • distribution
    • domain specific
    • geo
    • hierarchy
    • high dimensional
    • mashup
    • network
    • scale stacking
    • time
  • Articles
    • On Graphonyms: the Importance of Chart Type Names
  • Contact

3-dimensional mosaic plot

31st March 201831st March 2018maartenzam

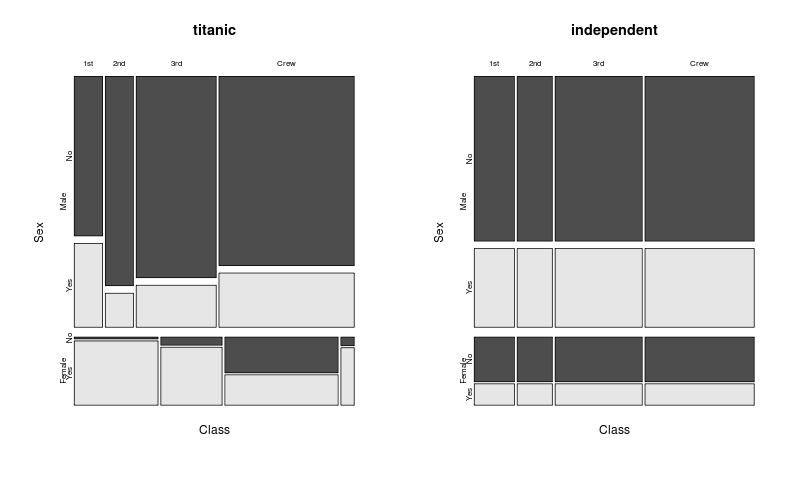
Mosaic plot (also known as Marimekko diagrams) is a graphical method for visualizing data from two or more qualitative variables.

Wikipedia: mosaic plot


Post navigation

Spike histogram
Double waterfall chart
Copyright © 2023 Xenographics.
Theme Highriser by ThemeMunk. Powered by WordPress.