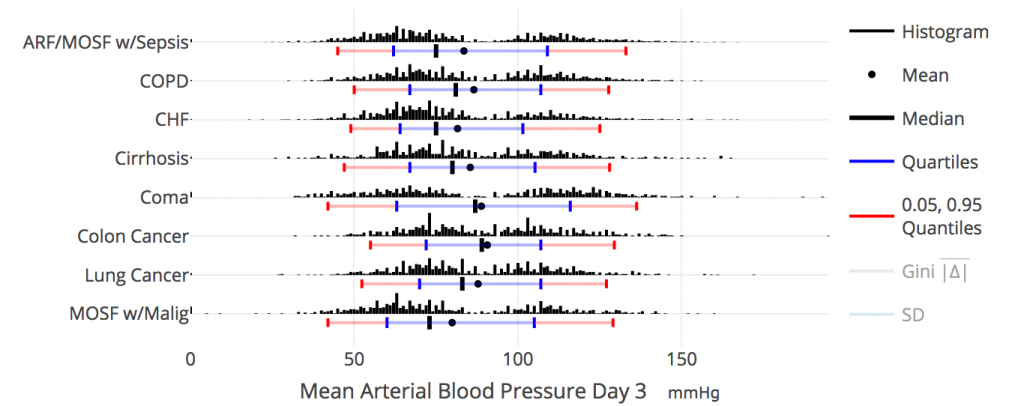
For spike histograms I typically use 100 or 200 bins. When the number of distinct data values is below the specified number of bins, I just do a frequency tabulation for all distinct data values, rounding only when two of the values are very close to each other. A spike histogram approximately reduces to a rug plot when there are no ties in the data.
Interactive Statistical Graphics: Showing More By Showing Less