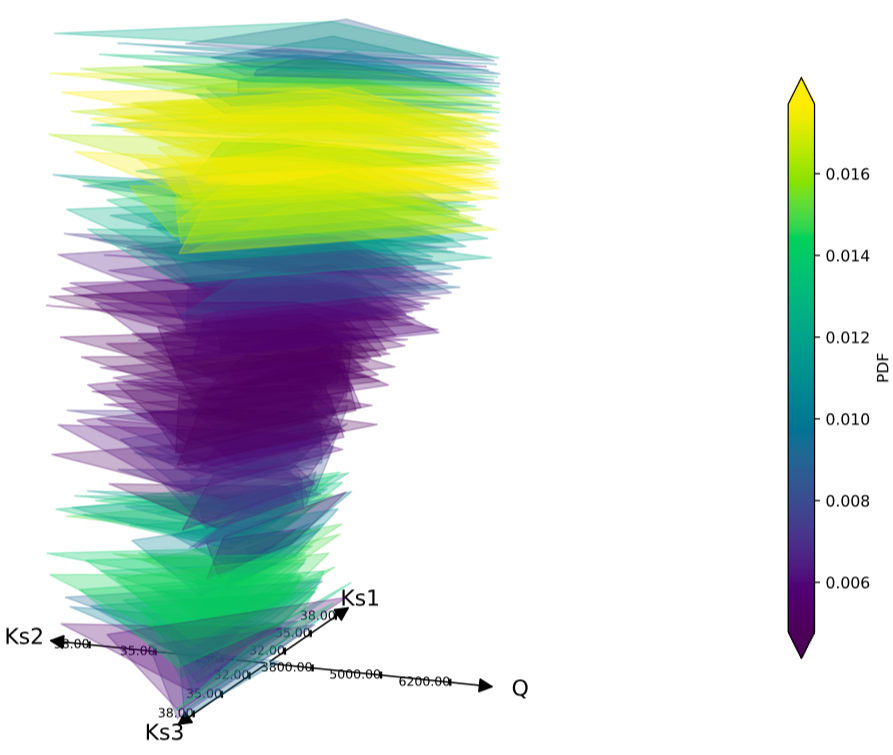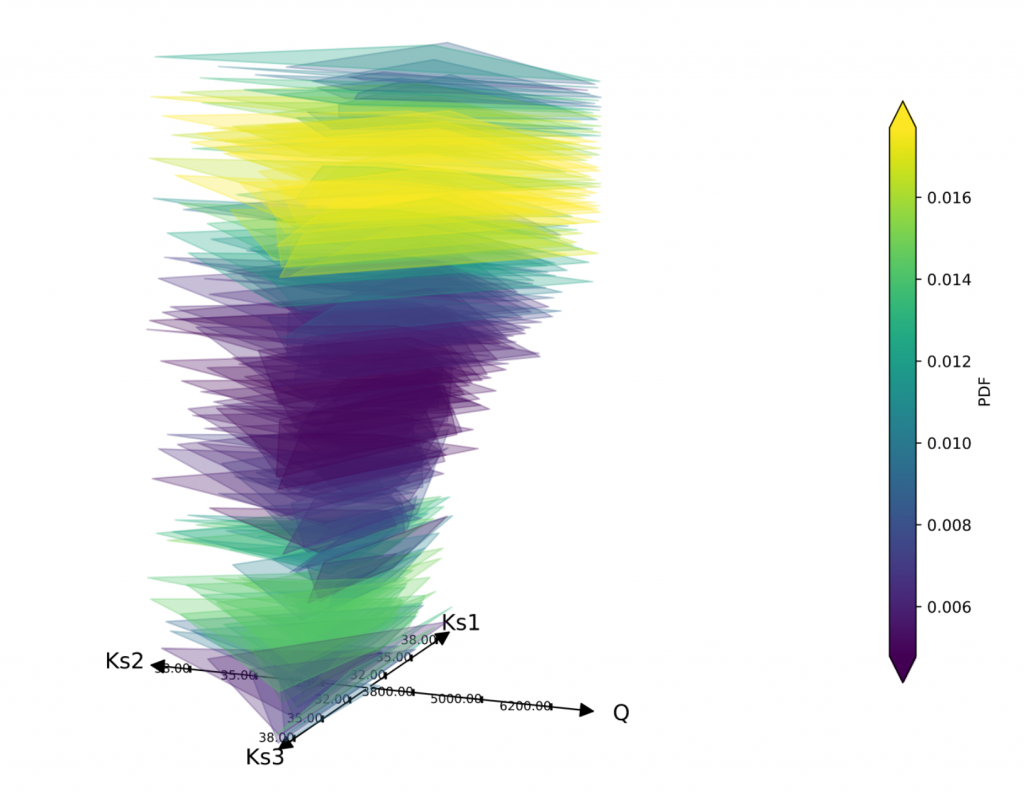
Allow to visualize multidimensional data based on Animated functional Hypothetical Outcome Plots (f-HOPs) and 3-dimensional Kiviat plot. Each stack represent an experiment with each axis being the corresponding set of input parameters of the experiment. The stack are ordered by quantity of interest and colored by difference to a reference experiment.