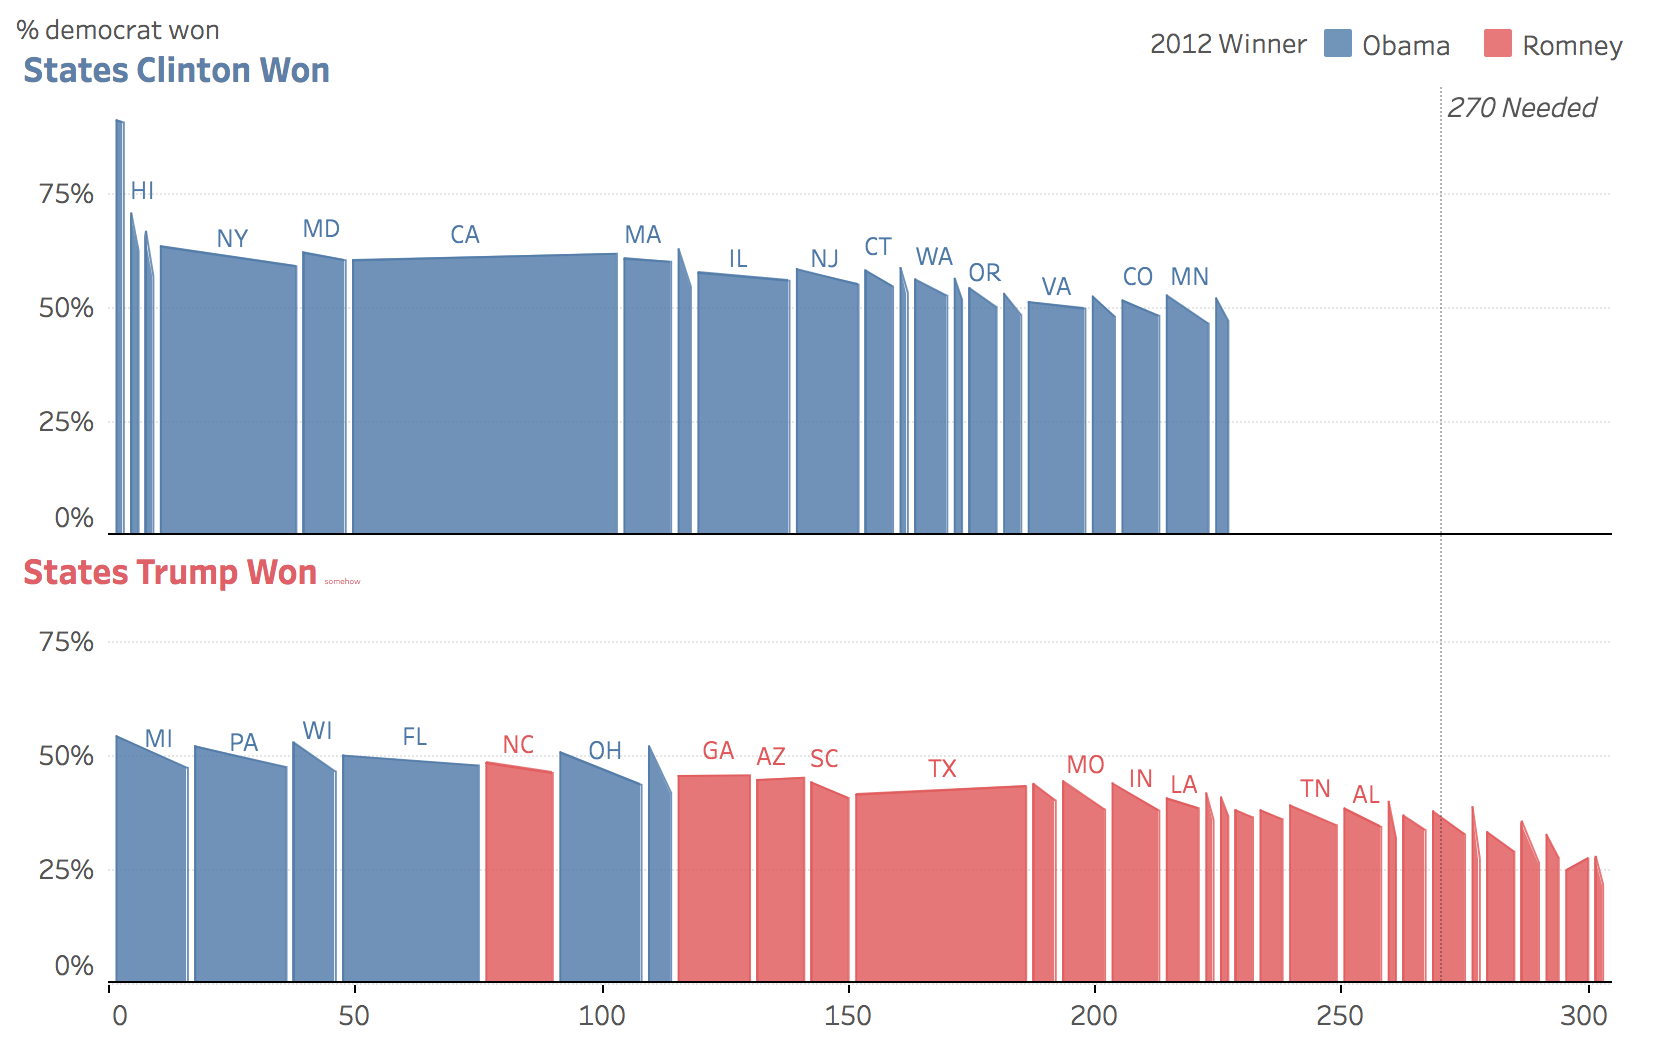
A Marimekko slope chart combines a Marimekko plot and a slope plot to create a unique chart type that I believe displays a combination of information better than current alternatives. The Marimekko slope chart is good for showing a comparison of discrete variables (bar chart), the population or size of these variables (bar width) and the trend of this discrete variable over two time periods (slope).