Xenographics

Weird but (sometimes) useful charts

  • Home
  • About
  • Submit
  • Tags
    • correlation
    • distribution
    • domain specific
    • geo
    • hierarchy
    • high dimensional
    • mashup
    • network
    • scale stacking
    • time
  • Articles
    • On Graphonyms: the Importance of Chart Type Names
  • Contact

Scatterplot of line charts

25th March 201827th March 2018maartenzam

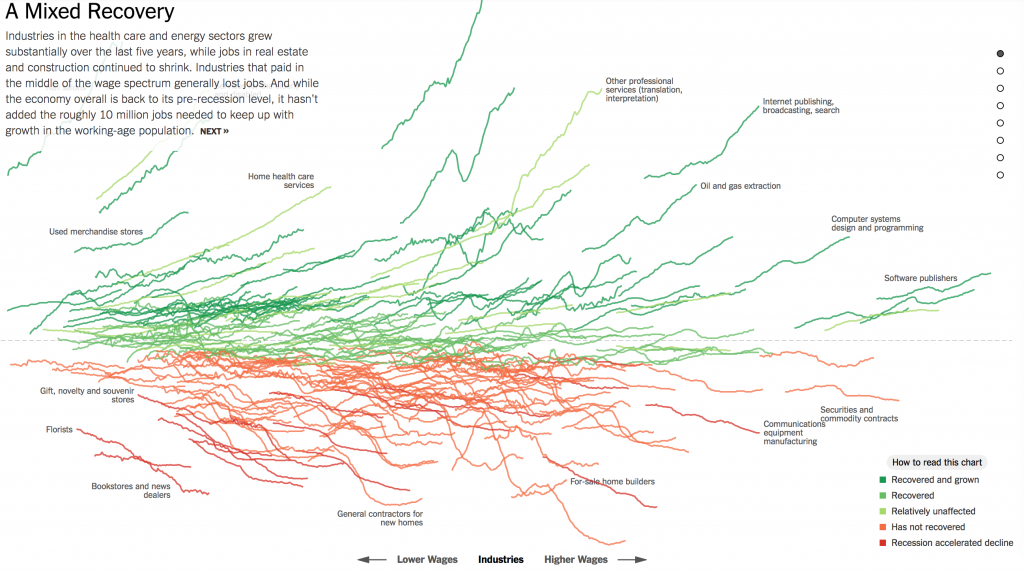
Small multiple line charts on a scatter plot.

Source: How the Recession Reshaped the Economy, in 255 Charts

Post navigation

Horizon chart
Muller plot
Copyright © 2025 Xenographics.
Theme Highriser by ThemeMunk. Powered by WordPress.