Xenographics

Weird but (sometimes) useful charts

  • Home
  • About
  • Submit
  • Tags
    • correlation
    • distribution
    • domain specific
    • geo
    • hierarchy
    • high dimensional
    • mashup
    • network
    • scale stacking
    • time
  • Articles
    • On Graphonyms: the Importance of Chart Type Names
  • Contact

Cycle plot

27th March 2018maartenzam
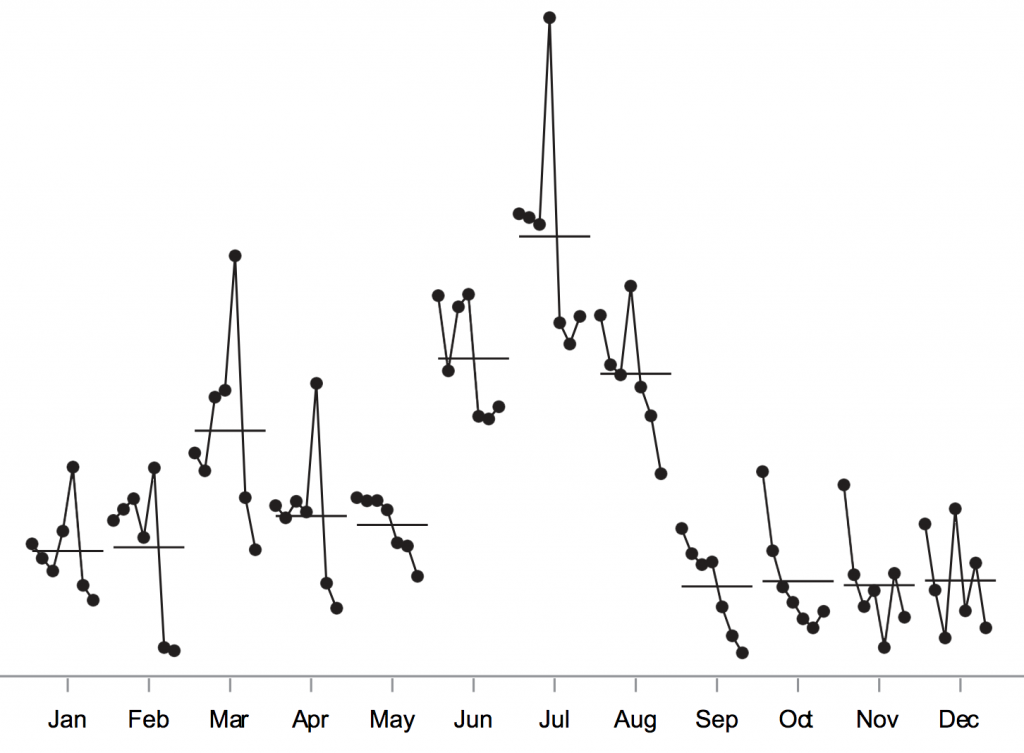
A cycle plot (Cleveland, Dunn, and Terpenning, 1978) shows both the cycle or trend and the day-of-the-week or the month-of-the-year effect.
Introduction to Cycle Plots

Post navigation

Stacked line chart
Scatterplot pie
Copyright © 2023 Xenographics.
Theme Highriser by ThemeMunk. Powered by WordPress.