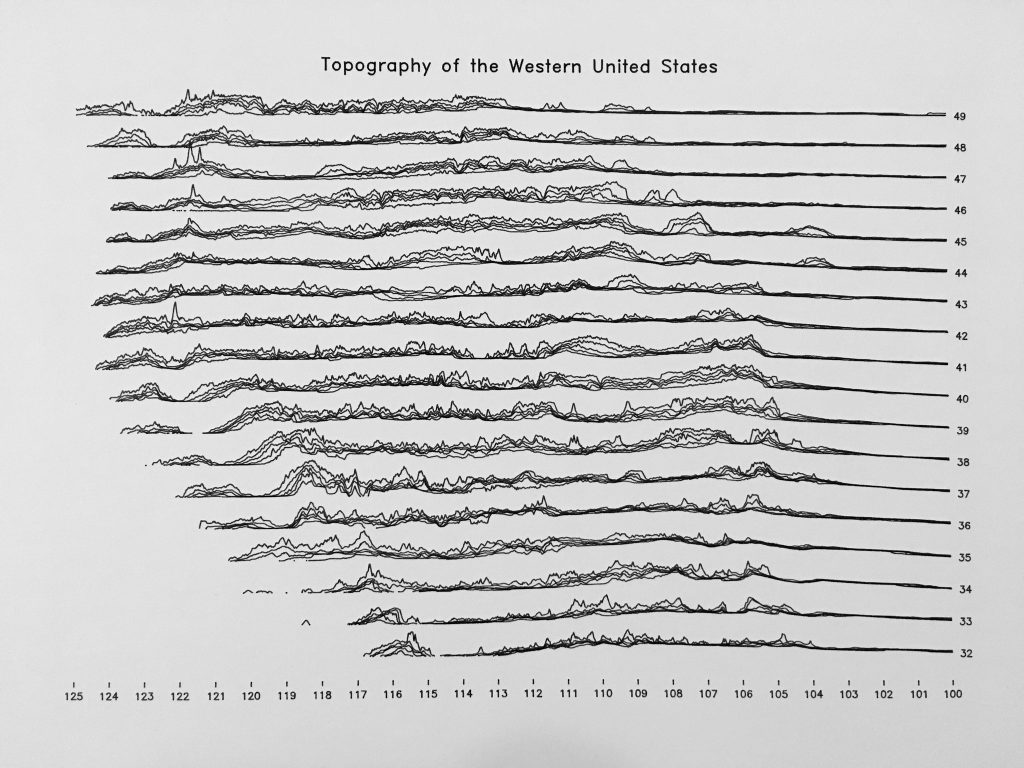
Each set of lines shows the 0, 25, 50, 75, 100th percentiles of elevation within its latitude swath.
Geoboxplot
Weird but (sometimes) useful charts
Each set of lines shows the 0, 25, 50, 75, 100th percentiles of elevation within its latitude swath.