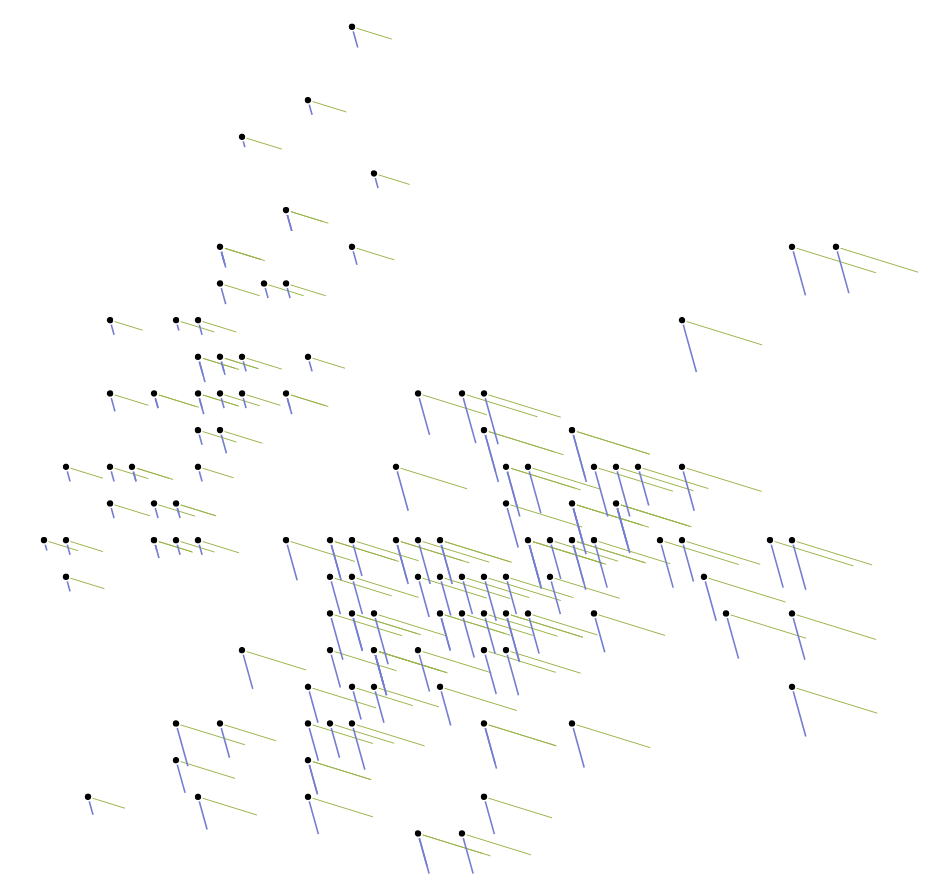
Designed to look for correlations between multiple variables, this chart plots two variables on a trusty scatter plot, and additional variables as tails from the points. Using tails lets us
- display more than one extra variable, rather than a bubble plot which is limited to one.
- encode the extra variables using length instead of area.
- show negative values; by plotting tails on the opposite site of the point, rather than using different coloured bubbles.