Kelp diagrams depict set relations over points, i.e. elements with predefined positions. Our method creates schematic drawings and has been designed to take aesthetic quality, efficiency and effectiveness into account.
Kelp diagram
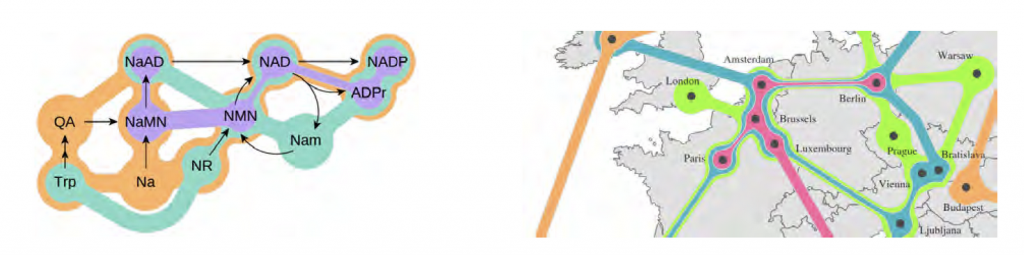
Weird but (sometimes) useful charts
Kelp diagrams depict set relations over points, i.e. elements with predefined positions. Our method creates schematic drawings and has been designed to take aesthetic quality, efficiency and effectiveness into account.