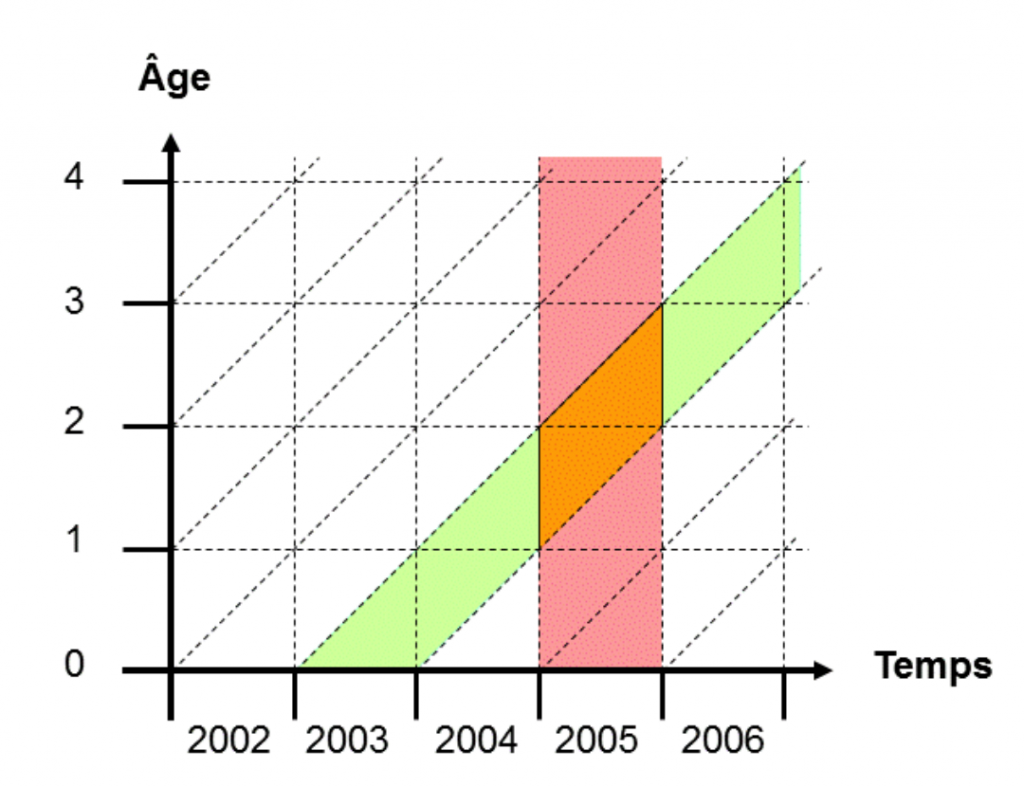
A Lexis diagram is a two dimensional diagram that is used to represent events (such as births or deaths) that occur to individuals belonging to different cohorts. Calendar time is usually represented on the horizontal axis, while age is represented on the vertical axis.
Lexis diagram