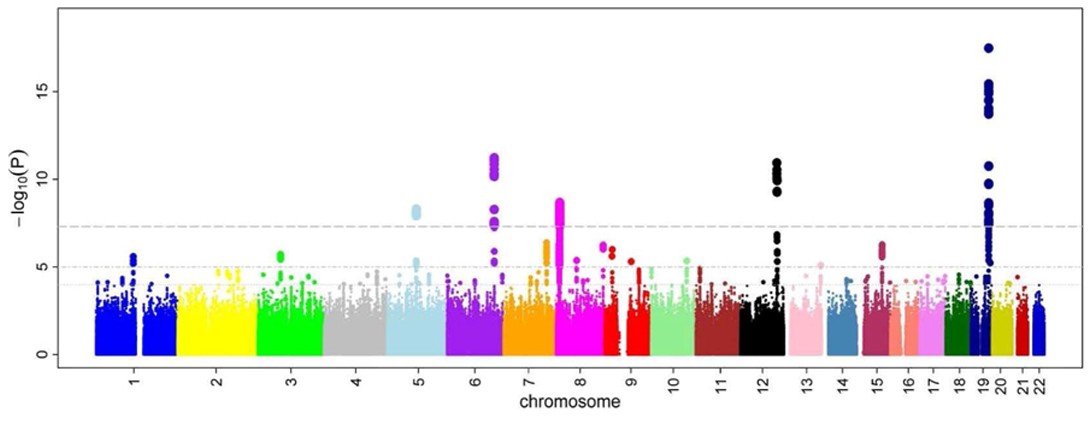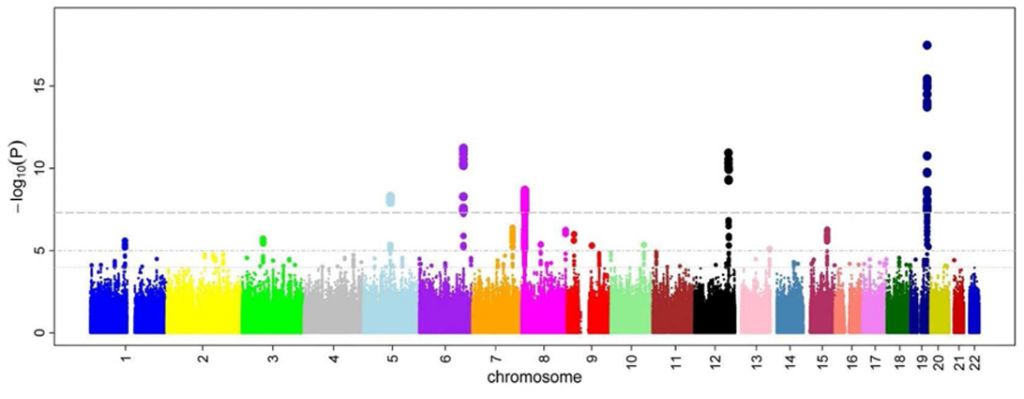
A Manhattan plot is a type of scatter plot, usually used to display data with a large number of data-points, many small valued and a few of higher-magnitude values. When coloured by some category, they resemble abusy city skyline with skyscrapers towering over many small buildings. They are popular for genetic genome-wide association studies.