I've made these for clients before and we called them Perception Maps, based on the nature of the data being displayed pic.twitter.com/DhWC0CTC0c
— Stephanie Evergreen (@evergreendata) February 16, 2018
Vector chart
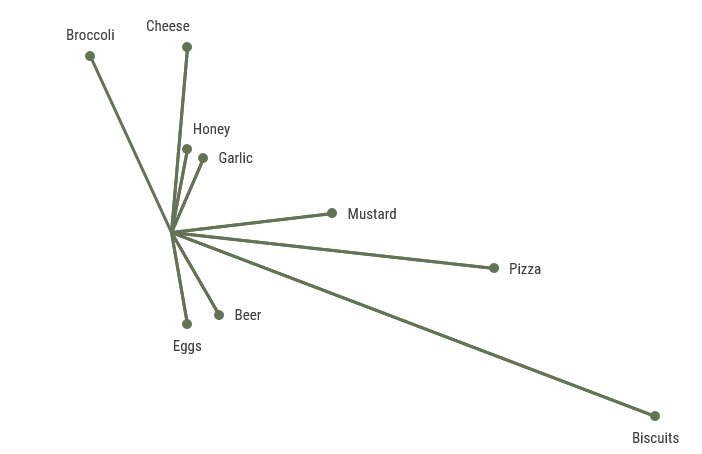
Weird but (sometimes) useful charts
I've made these for clients before and we called them Perception Maps, based on the nature of the data being displayed pic.twitter.com/DhWC0CTC0c
— Stephanie Evergreen (@evergreendata) February 16, 2018